
ESPN Fantasy
League History
As a Fantasy sports season concludes, fan's league results and history are lost permanently. I was tasked with how to save and archive previous Fantasy season's historical data for fans in the league to reference in the future. This was the 2nd most requested feature by fans so it became important to solve this problem.
Company
The Walt Disney Company
Line of Business
ESPN
Product
ESPN Fantasy App
Role
UI Design, UX Design, Product Stategy
The Why
ESPN Fantasy had strong justification to add League History to the Fantasy product.
The Why
ESPN Fantasy had strong justification to add League History to the Fantasy product.
2nd most requested feature by fans
League History was the 2nd most requested feature by our fans. Our team noted their feedback through various channels and listened to them.
2nd most requested feature by fans
League History was the 2nd most requested feature by our fans. Our team noted their feedback through various channels and listened to them.
Builds long-term loyalty & investment
Increased loyalty and investment to ESPN Fantasy. The longer a league is around, the more difficult it becomes to leave years of historical data behind for competitors.
Builds long-term loyalty & investment
Increased loyalty and investment to ESPN Fantasy. The longer a league is around, the more difficult it becomes to leave years of historical data behind for competitors.
Problem Statement
ESPN Fantasy does not save league historical data for fans after a season concludes, preventing them from being able to look back at previous season's results.
ESPN Fantasy stores historical data internally on their servers but wipes the data clean for the fan at the conclusion of a season. Why are we not letting the fan reference it?
Season results are not retained after the end of the season
Season results are not retained after the end of the season
No way to look back at how you placed in previous seasons
No way to look back at how you placed in previous seasons
No way to look back at league standings from previous seasons
No way to look back at league standings from previous seasons
Lack of insights for fans to reference & learn from in future seasons
Lack of insights for fans to reference & learn from in future seasons
Less appeal to come back season after season
Less appeal to come back season after season
The Goal
Save the fan's historical data and present valuable insights that keeps them invested in ESPN Fantasy year after year
The Goal
Save the fan's historical data and present valuable insights that keeps them invested in ESPN Fantasy year after year
Product Goals:
Save historical league data for future reference
Save historical league data for future reference
Provide a year-by-year breakdown of each season
Provide a year-by-year breakdown of each season
Provide a higher level overview of the fans team all-time
Provide a higher level overview of the fans team all-time
Design Goals:
Avoid relying on tables. No spreadsheets allowed.
Avoid relying on tables. No spreadsheets allowed.
Enhance the data by displaying it in a compelling, visually rich way
Enhance the data by displaying it in a compelling, visually rich way
Bring the most important data to the surface
Bring the most important data to the surface
User Stories
As an ESPN Fantasy user that has Fantasy team's from the past…
User Stories
As an ESPN Fantasy user that has Fantasy team's from the past…
"I want to know who the reigning champ is from last season"

"I want to know who the reigning champ is from last season"
"I want to know who the reigning champ is from last season"
"I want to know how I placed last season"

"I want to know how I placed last season"
"I want to know how I placed last season"
"I want to see who won the league 8 years ago"

"I want to see who won the league 8 years ago"
"I want to see who won the league 8 years ago"
"I want to see when my fantasy league was created"

"I want to see when my fantasy league was created"
"I want to see when my fantasy league was created"
"I would like to analyze previous seasons for insights"

"I would like to analyze previous seasons for insights"
"I would like to analyze previous seasons for insights"
"I want to know which team has been the best over the years"

"I want to know which team has been the best over the years"
"I want to know which team has been the best over the years"
"I want to know which team has given me the most trouble"

"I want to know which team has given me the most trouble"
"I want to know which team has given me the most trouble"
"I want to know which team I have dominated the most"

"I want to know which team I have dominated the most"
"I want to know which team I have dominated the most"
"I want to know what my stats are all-time"

"I want to know what my stats are all-time"
"I want to know what my stats are all-time"
Inspiration
Inspiration came in many forms, even outside of the traditional competitive fantasy sports landscape
I was intentional about looking for inspiration around performance summary data, no matter the product space. I noticed a lot of potential parallels with League History and the fitness product space. Analyzing the types of data, insights and presentation of information in popular fitness apps put myself and my product partner in the right mindset when ideating.


Affinity Mapping
As a Fantasy user, what historical data would I care about seeing from previous seasons?
After brainstorming user stories with my product partner, we affinity mapped our ideas into themes, of which became the backbone of our information architucture.
Affinity Mapping
As a Fantasy user, what historical data would I care about seeing from previous seasons?
After brainstorming user stories with my product partner, we affinity mapped our ideas into themes, of which became the backbone of our information architucture.
Season Breakdown
Breakdown by individual seasons
How my team placed each season
Team record & win percentage
Year-by-year standings
Top players each season
The champion for each season
Which team had the most wins
The league's longest winning streak
The league's longest losing streak
The leagues biggest blowout
Trophies
All-time Insights
Holistic breakdown across all seasons
Team record & win percentage
All-time team performance metrics
How fan's team compares to top performing ones
All-time standings
Toughest opponent
Easiest opponent
Strongest performance areas
Weakest performance areas
Avereage points scored per matchup
How many championships I won, if any
How many times I appeared in the playoffs, if at all
How many seasons I have played with my league
Wireframes
Wireframing showed that not every piece of data needed to be presented up front on 1 screen
Referencing what I learned from affinity mapping features into categories, year-by-year breakdowns and all-time insights became 2 major pieces of the information architecture. Nesting less important data into secondary screens was key in reducing cognitive overload on 1 screen.

Information Architecture
Ensuring discoverability by adding League History where fans go for similar information
ESPN Fantasy app has conditioned fans to go to the League Office tab for league information. After the season is complete, it felt natural to archive the completed season's historical data there. That allows only the current season's data to be present at the highest level.

League History Summary
The summary screen is the fan's high level dashboard with the ability to dive deeper into specific areas
League History Summary
The summary screen is the fan's high level dashboard with the ability to dive deeper into specific areas


League Info
Basic information like year created and League Manager history.
League Info
Basic information like year created and League Manager history.
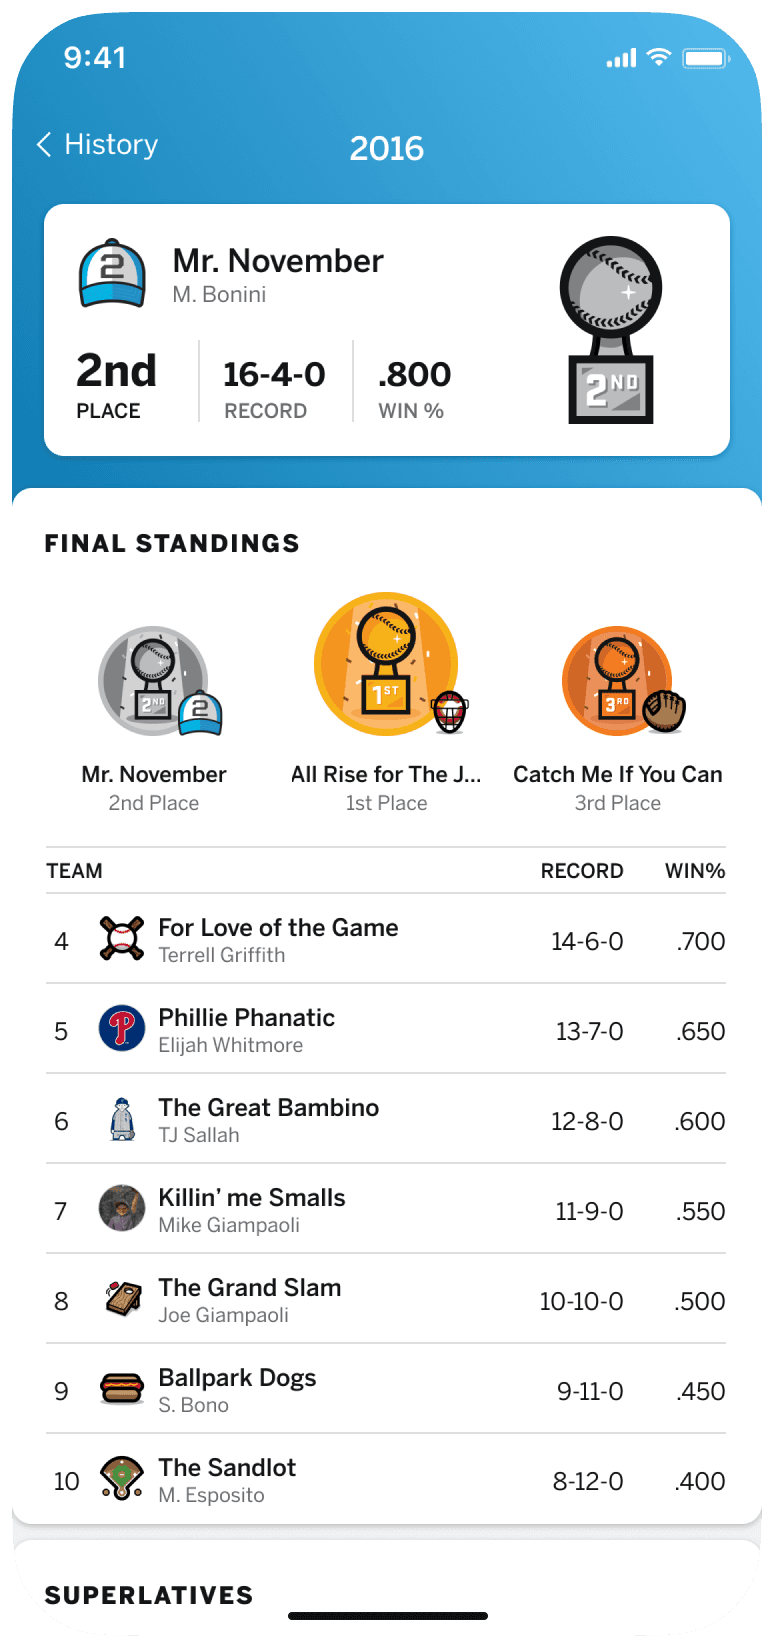
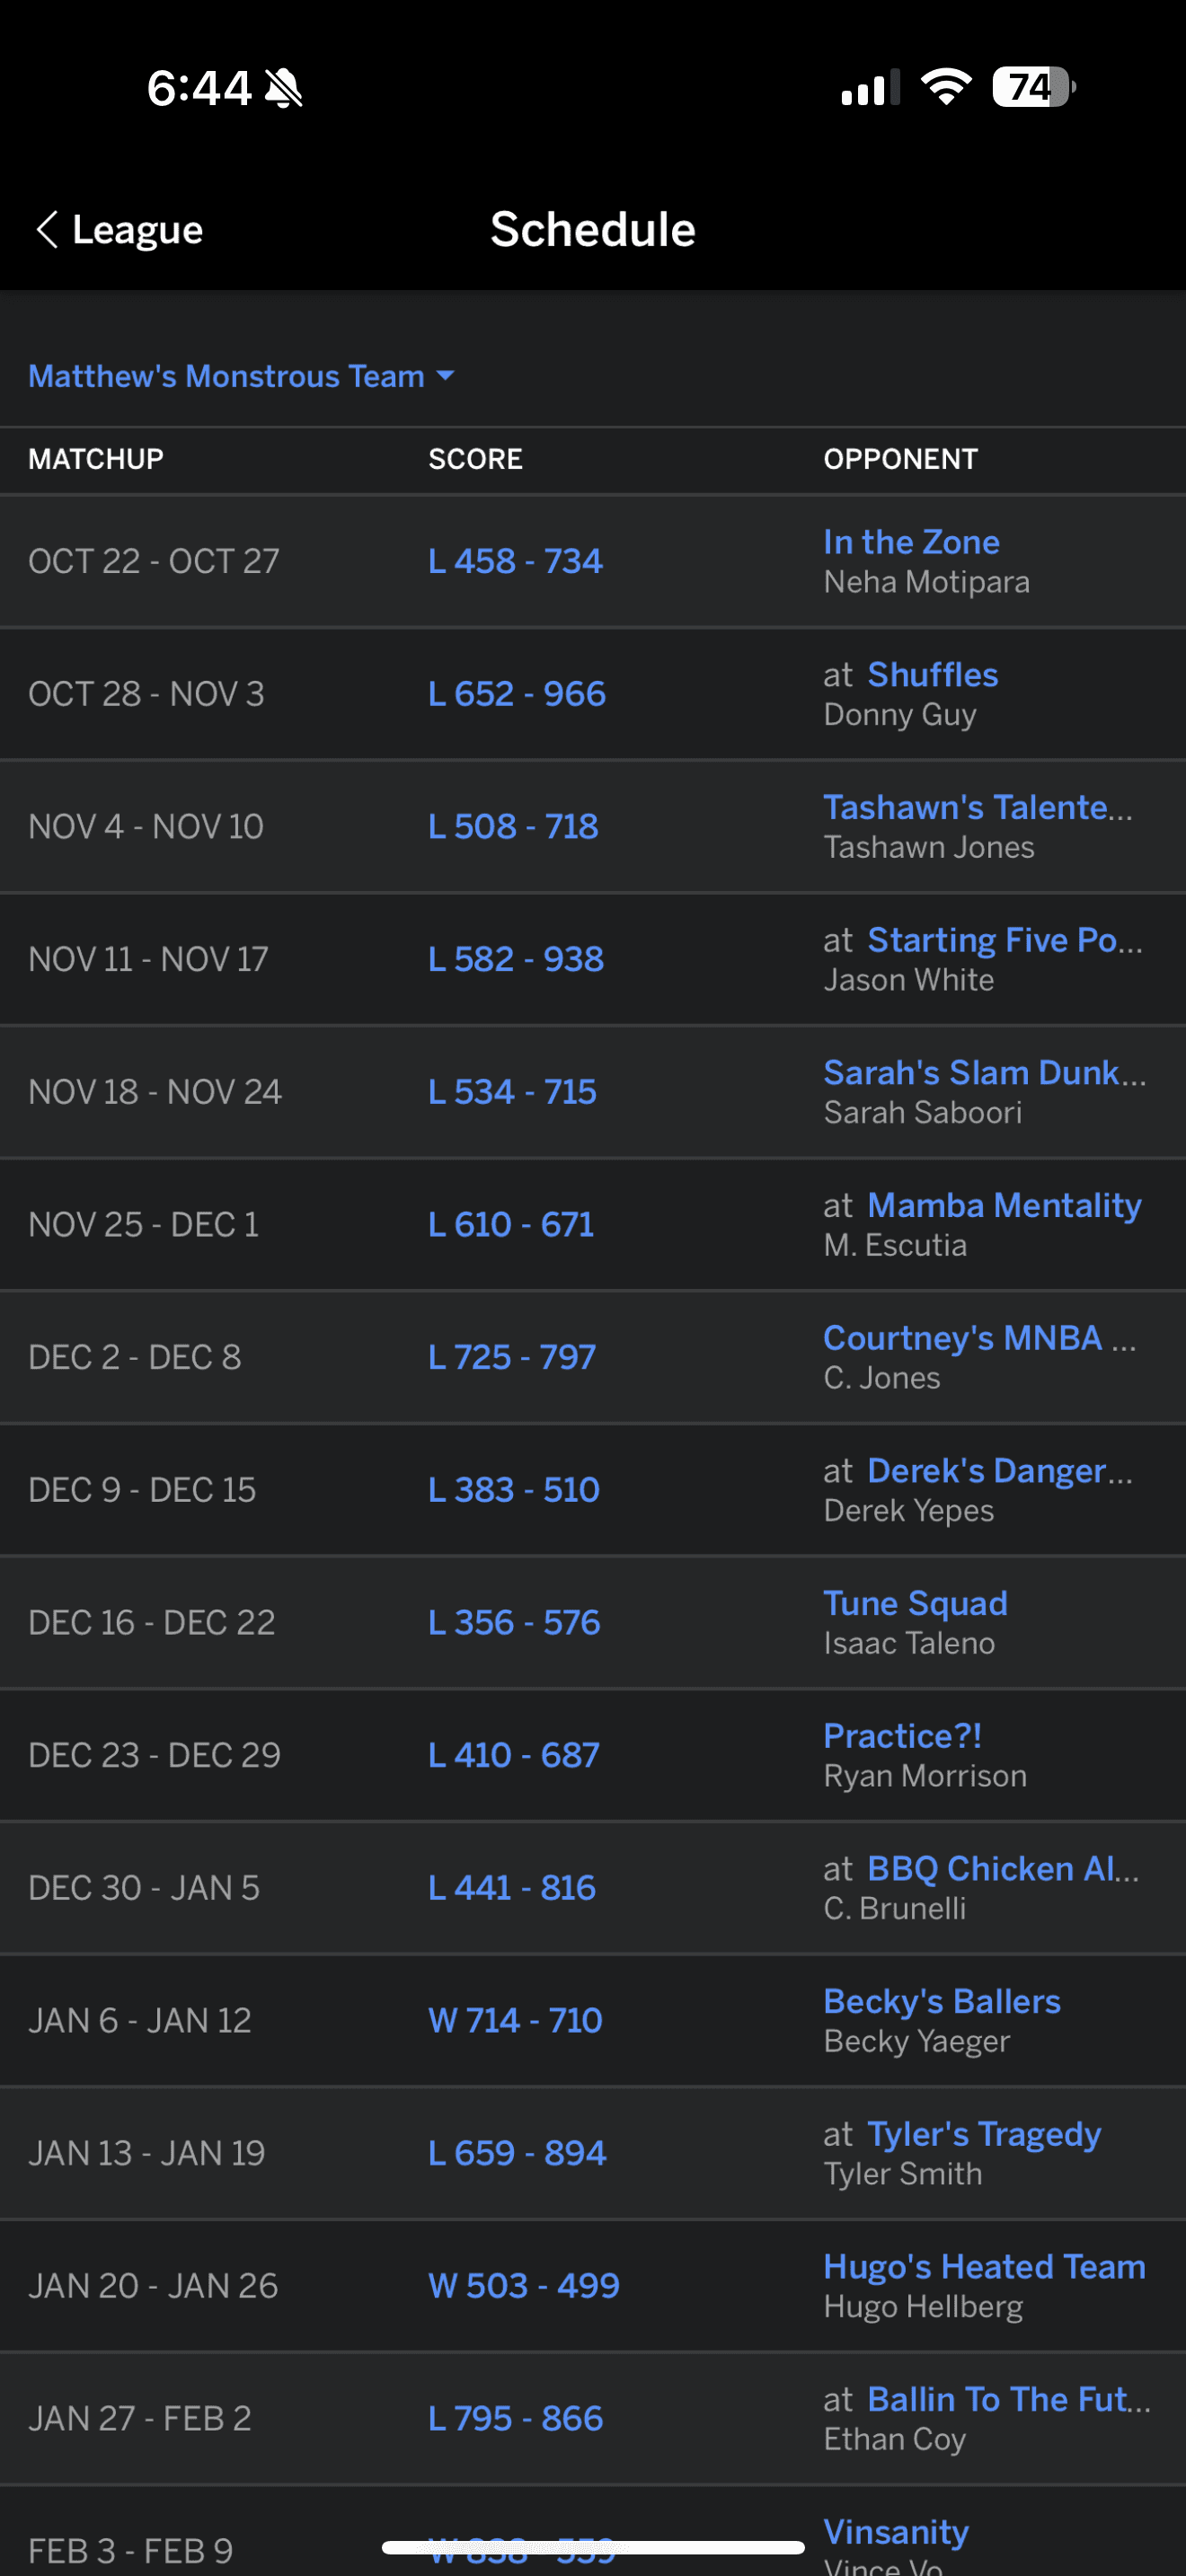
Year-By-Year
The fan's results each season along with the league champion. This is where the fan can choose to dive deeper into an individual season breakdown.
Year-By-Year
The fan's results each season along with the league champion. This is where the fan can choose to dive deeper into an individual season breakdown.
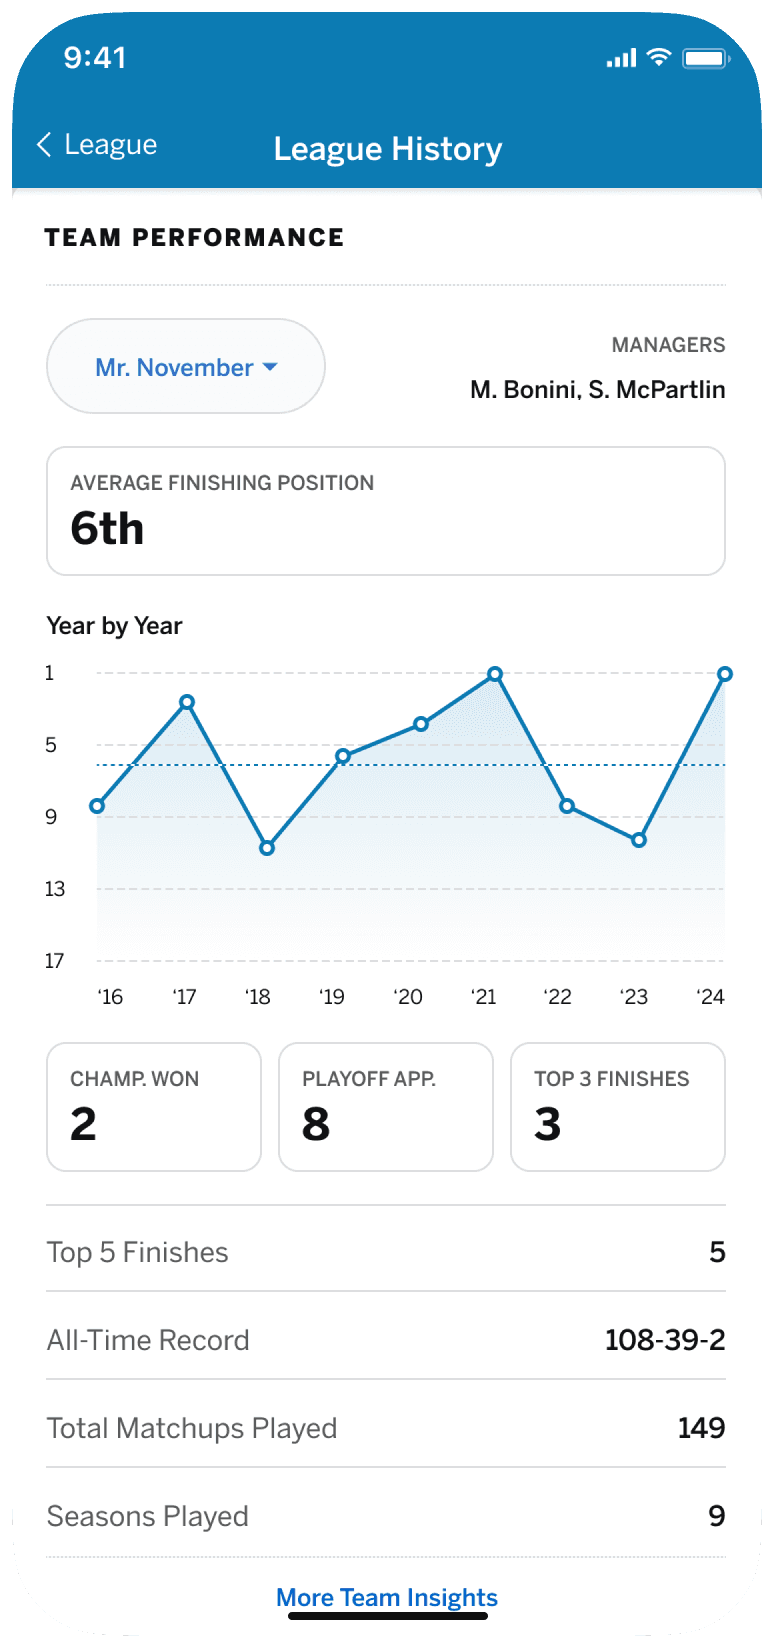
Team Performance
Finishing position for every season, high level performance metrics and the ability to select and view another team's history here as well. Dive deeper into All-Time Insights.
Team Performance
Finishing position for every season, high level performance metrics and the ability to select and view another team's history here as well. Dive deeper into All-Time Insights.
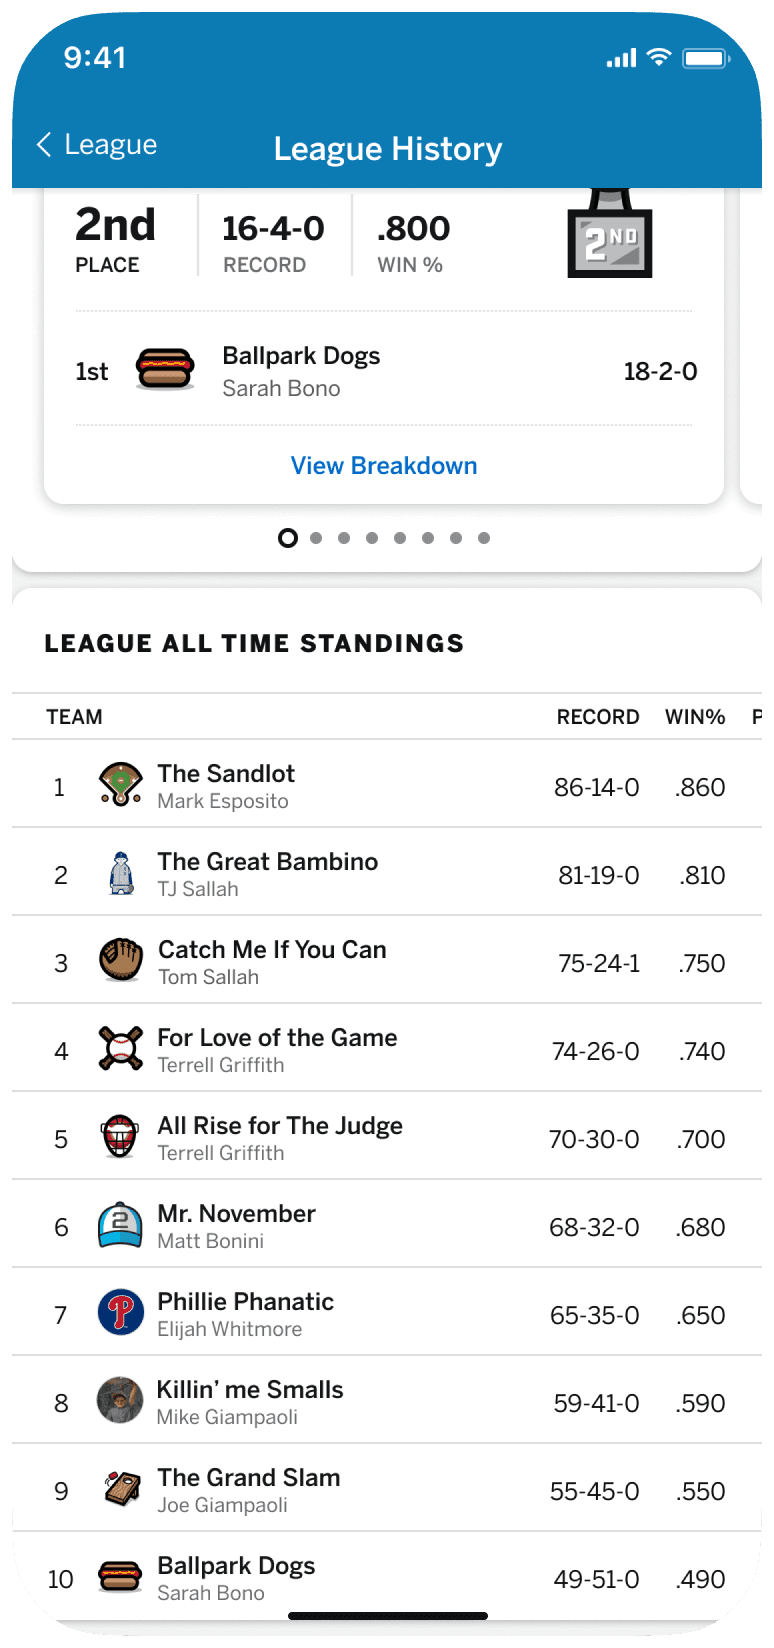
All-Time Standings
Cumulative standings results across the duration of the league's history. This is how you find out who's been consistently dominant or not so dominant over the years.
All-Time Standings
Cumulative standings results across the duration of the league's history. This is how you find out who's been consistently dominant or not so dominant over the years.
All-Time Insights
All-time team insights paints a picture for how the fan's team has performed holistically in it's league's history.
All-Time Insights
All-time team insights paints a picture for how the fan's team has performed holistically in it's league's history.


Performance
High level performance metrics like playoff appearances, championships won and top finishes illustrates the level of success.
Performance
High level performance metrics like playoff appearances, championships won and top finishes illustrates the level of success.
Record & win %
Breaking down wins, losses and ties year-by-year in a visually rich way helps to easily analyize the ups and downs of your fantasy career.
Record & win %
Breaking down wins, losses and ties year-by-year in a visually rich way helps to easily analyize the ups and downs of your fantasy career.
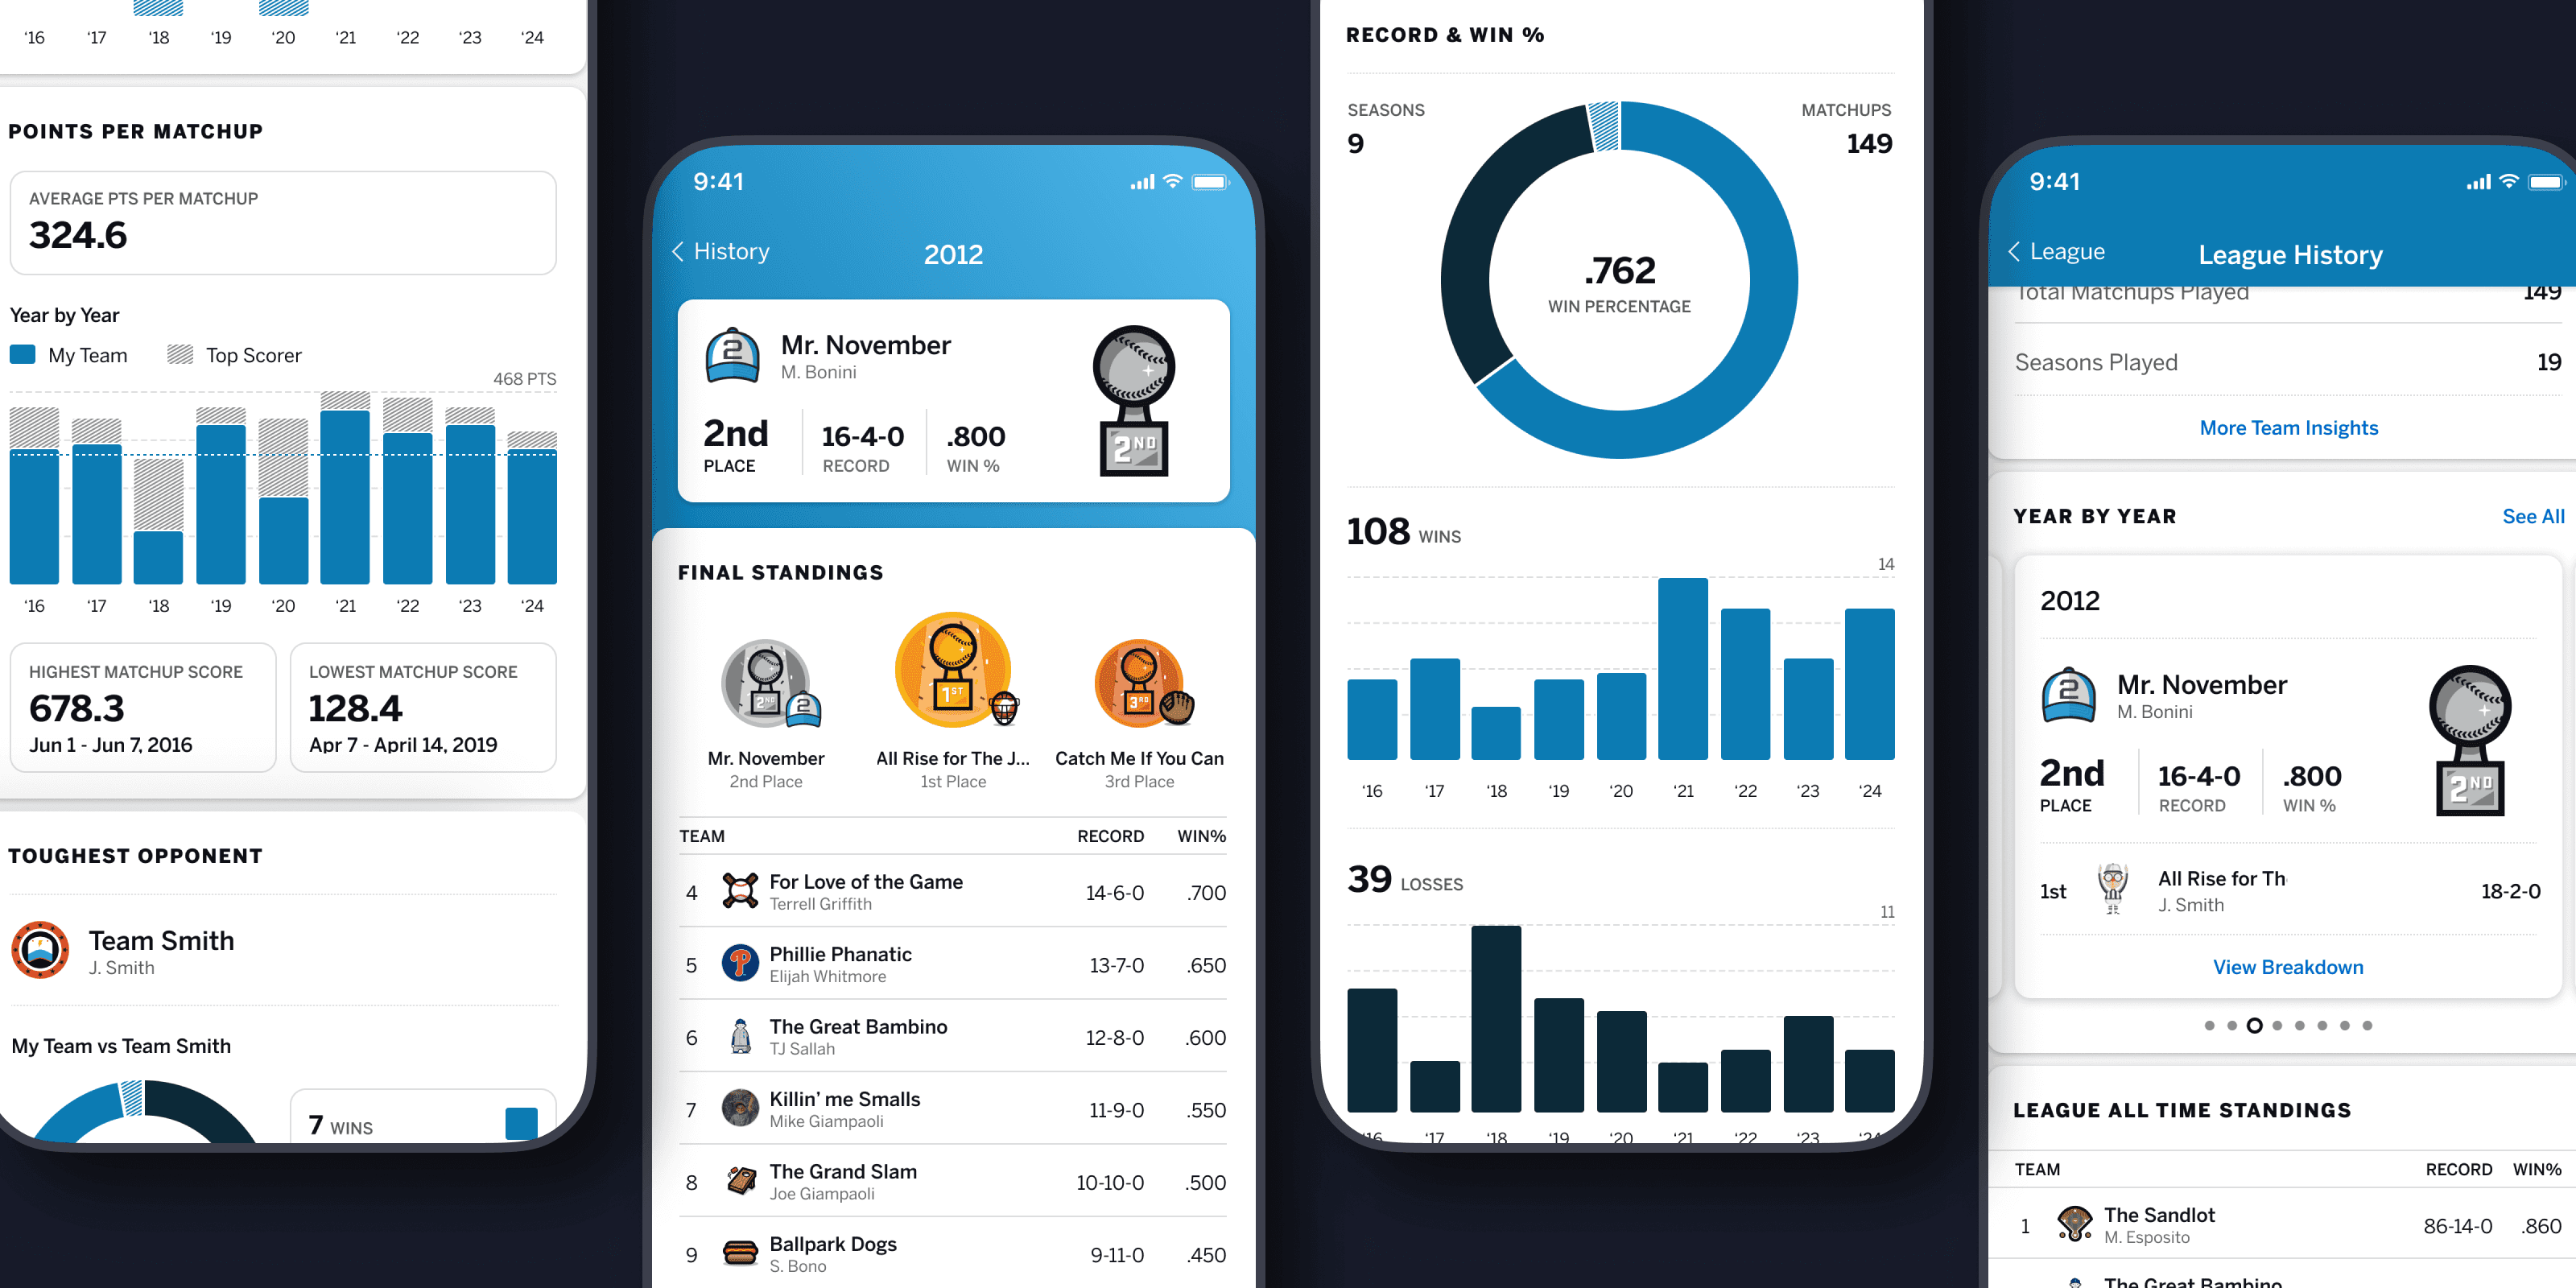
Points per matchup
Allows fans to analyze scoring patterns across seasons and compare against the top scorer in the league to see how far off the mark they are.
Points per matchup
Allows fans to analyze scoring patterns across seasons and compare against the top scorer in the league to see how far off the mark they are.
Toughest & easiest opponents
Helps the fan understand who they are excelling against and who they need to work harder to beat.
Toughest & easiest opponents
Helps the fan understand who they are excelling against and who they need to work harder to beat.
Year-by-Year Breakdown
Year-by-Year breakdowns zoom into each season, allowing fans to look back in time
Year-by-Year Breakdown
Year-by-Year breakdowns zoom into each season, allowing fans to look back in time

Final stat line
Key end-of-season metrics like finishing position, record and win percentage are the baseline expectations for looking back at previous seasons.
Final stat line
Key end-of-season metrics like finishing position, record and win percentage are the baseline expectations for looking back at previous seasons.
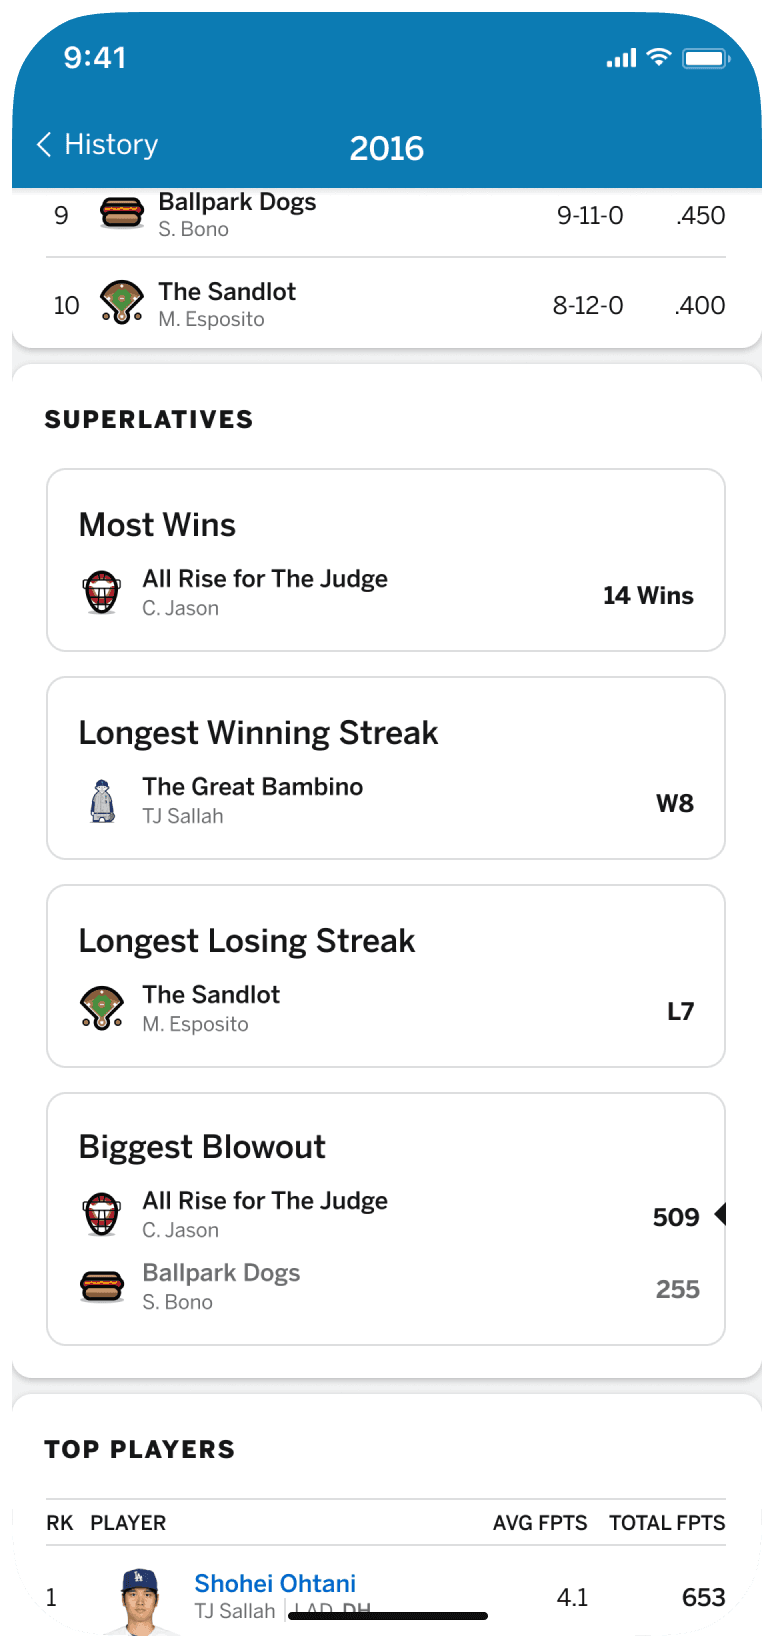
Superlatives
Draws parallels to familiar season ending awards from real sports that fans look forward to while creating fun competition and providing valuable insights.
Superlatives
Draws parallels to familiar season ending awards from real sports that fans look forward to while creating fun competition and providing valuable insights.
Final standings
It's just as important to see how the rest of the competition performed. Whether that be for bragging rights or gathering insights to plan your team's future strategy.
Final standings
It's just as important to see how the rest of the competition performed. Whether that be for bragging rights or gathering insights to plan your team's future strategy.
Top players
Helps fans to understand how their roster may stack up against the rest of the league’s and inform future roster decisions.
Top players
Helps fans to understand how their roster may stack up against the rest of the league’s and inform future roster decisions.
Data Visualization
Creating net new data visualization to enhance presentation and digestion of information
Data visualizations help aid in the digestion of information when done right and in the right scenarios. In addition to its functional purpose, data visualization is an opportunity to add visual interest to the UI.

ESPN relys on dense tables too much
ESPN relys on dense tables to display data way too often which can make the UI feel like a spreadsheet. I wanted to start finding better ways to visualize data and in the right moments. League History felt like the perfect opportunity.
ESPN relys on dense tables too much
ESPN relys on dense tables to display data way too often which can make the UI feel like a spreadsheet. I wanted to start finding better ways to visualize data and in the right moments. League History felt like the perfect opportunity.
Lacks hierarchy
Lacks hierarchy
Too dense
Too dense
Feels like a spreadsheet
Feels like a spreadsheet
Difficult to scan
Difficult to scan


Leveraging the ESPN Fantasy Brand
I leveraged the ESPN Fantasy brands to style our data visualizations uniquely to each sport's game. The color created brand harmony and visual impact in the UI.
Leveraging the ESPN Fantasy Brand
I leveraged the ESPN Fantasy brands to style our data visualizations uniquely to each sport's game. The color created brand harmony and visual impact in the UI.

Accessible for everyone
High contrast solid colors and patterns ensured each data value and the surface color they sat on met WCAG AA accessibility standards. I did this for light and dark mode.
Accessible for everyone
High contrast solid colors and patterns ensured each data value and the surface color they sat on met WCAG AA accessibility standards. I did this for light and dark mode.

Valuable interactions
Utilizing a common touch and hold gesture, fans can dive deeper for secondary information, preserving the scannability of the graphs while keeping cognitive load at a minimum.
Valuable interactions
Utilizing a common touch and hold gesture, fans can dive deeper for secondary information, preserving the scannability of the graphs while keeping cognitive load at a minimum.

Scalable for years
Leagues can vary in season age, requiring I stress test data visualizations anywhere from 1 to 20+ seasons of historical data to display.
Scalable for years
Leagues can vary in season age, requiring I stress test data visualizations anywhere from 1 to 20+ seasons of historical data to display.
Impact
Delivered what the fan's asked for ✅
Impact
Delivered what the fan's asked for ✅
We listened to fans
Successfully launched one of the most requested feature by fans.
We listened to fans
Successfully launched one of the most requested feature by fans.
Historical data recovered
Once launched, historical data was retroactively populated since ESPN had it stored internally.
Historical data recovered
Once launched, historical data was retroactively populated since ESPN had it stored internally.
Referencing past season's now possible
The fan is finally able to look back at past seasons for results and insights.
Referencing past season's now possible
The fan is finally able to look back at past seasons for results and insights.
Incentivizing Loyalty
We have given the fan another reason to stay invested in ESPN Fantasy.
Incentivizing Loyalty
We have given the fan another reason to stay invested in ESPN Fantasy.
2024 performance metrics
14M
Page views
14M
Page views
4M
Unique visitors
4M
Unique visitors
4.5M
League seasons archived
4.5M
League seasons archived